Today
Conceptual, operational & statistical hypothesis
Null Hypothesis Significance testing
p-values
 PDF
PDFHypothesis
Statement about something in the world
- Often in terms of differences or relationships between things/people/groups
Must be testable: it must be possible for the data to either support or disconfirm a hypothesis
Should be about a single thing
 PDF
PDFLevels of hypothesis
Conceptual: Expressed in normal language on the level of concepts/constructs
Operational: Restates a conceptual hypothesis in terms of how constructs are measured in a given study
Statistical: Translates an operational hypothesis into language of mathematics
 PDF
PDFConceptual hypotheses
Expressed in normal language on the level of concepts/constructs
Good hypothesis: "The recent observed rising trend in global temperatures on Earth is primarily driven by human-produced greenhouse gas emissions."
 PDF
PDFConceptual hypotheses
Expressed in normal language on the level of concepts/constructs
Good hypothesis: "The recent observed rising trend in global temperatures on Earth is primarily driven by human-produced greenhouse gas emissions."
Bad hypothesis: "Homœopathic products can cure people, but sometimes they make them worse before they make them better, and the effect is only apparent subjectively with respect to some vague 'holistic' notions rather than a specific well-defined and testable set of criteria."
 PDF
PDFFrom research question to conceptual hypothesis
Let's say we're interested in factors predicting sport climbing performance
Research question: Are there morphological characteristics that predispose some people to be better at climbing?
We have a hunch that having relatively long arms might be beneficial
Conceptual hypothesis: Climbers have relatively longer arms than non-climbers
 PDF
PDFOperationalisation
To be able to formulate a hypothesis in statistical terms, we first need to get from the conceptual level to the level of measurement
Operationalisation is the process of defining variables in terms of how they are measured
The concept of intelligence can be operationalised as total score on Raven's Progressive Matrices
The concept of cognitive inhibition can be operationalised as (some measure of) performance on the Stroop test.
 PDF
PDFExample: The Ape Index
The ape index (AI) compares a person's arm span to their height
Positive AI means, that your arm span is larger then your height
165 cm (5′5″) tall person with an arm span of 167 cm has an ape index of +2
Found to correlate with performance in some sports (e.g., climbing, swimming, basketball)
 PDF
PDFOperational hypotheses
- Conceptual hypothesis: Climbers have relatively longer arms than non-climbers
- Operational hypothesis: Elite climbers have, on average, a higher ape index than general population
 PDF
PDFStatistical hypotheses
Translation of an operational hypothesis to the language of maths
Deals with specific values (or ranges of values) of population parameters
Mean of a given population can be hypothesised do be of a given value
We can hypothesise a difference in means between two populations
 PDF
PDFStatistical hypothesis
- Conceptual hypothesis: Climbers have relatively longer arms than non-climbers
- Operational hypothesis: Elite climbers have, on average, a higher ape index than general population
- Statistical hypothesis: μAI_climb>μAI_gen
 PDF
PDFRemember
We are interested in population parameters
However, we cannot measure them
We can estimate them based on sample statistics
 PDF
PDFTesting hypotheses
- So we measure a climber and a non-climber and compare them to test our hypothesis
 PDF
PDFTesting hypotheses
So we measure a climber and a non-climber and compare them to test our hypothesis
We find that the climber has a higher AI than the non-climber
 PDF
PDFTesting hypotheses
So we measure a climber and a non-climber and compare them to test our hypothesis
We find that the climber has a higher AI than the non-climber
Hypothesis confirmed; we happy
 PDF
PDFTesting hypotheses
So we measure a climber and a non-climber and compare them to test our hypothesis
We find that the climber has a higher AI than the non-climber
Hypothesis confirmed; we happy
We happy?
 PDF
PDFTesting hypotheses
So we measure a climber and a non-climber and compare them to test our hypothesis
We find that the climber has a higher AI than the non-climber
Hypothesis confirmed; we happy
We happy?
No, the individuals might not be representative of the populations
 PDF
PDFProblem with samples
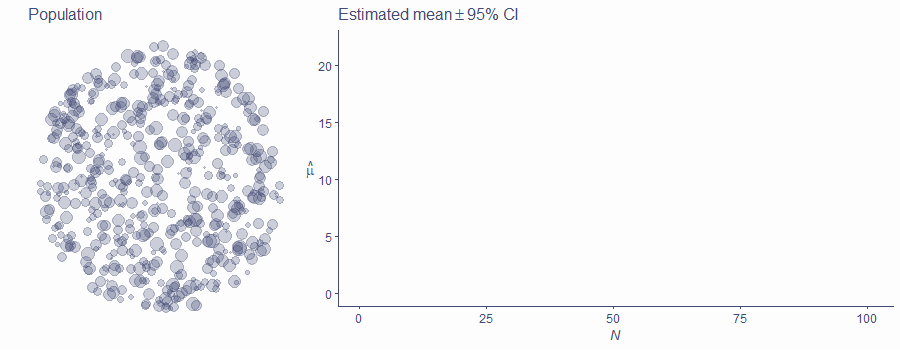
We need to collect a larger sample
However, the principled problem remains: sample mean might not reflect μ accurately
 PDF
PDFThe bigger, the better!
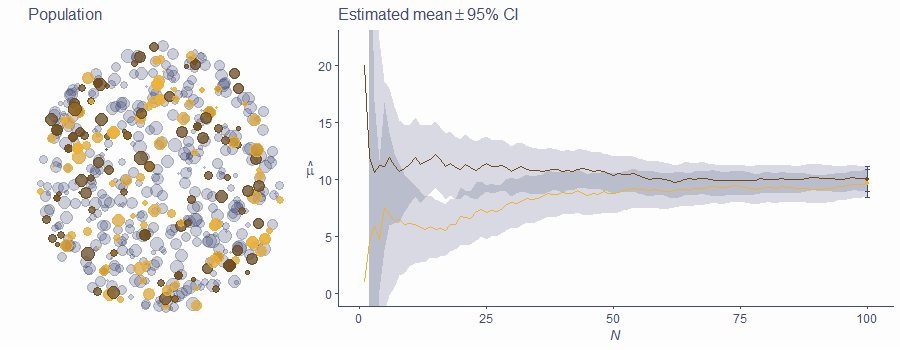
There are statistical fluctuations; they get less important as N get bigger
Means converge to the true value of μ as N increases
CIs get exponentially smaller with N; statistical power increases
False positives (and negatives!) happen
 PDF
PDFDecisions, decisions
- How do we decide that a difference/effect in our sample actually exists in population?
 PDF
PDFDecisions, decisions
How do we decide that a difference/effect in our sample actually exists in population?
One possible way is using Null Hypothesis Significance Testing (NHST)
 PDF
PDFDecisions, decisions
How do we decide that a difference/effect in our sample actually exists in population?
One possible way is using Null Hypothesis Significance Testing (NHST)
- There is strong criticism of this approach
 PDF
PDFDecisions, decisions
How do we decide that a difference/effect in our sample actually exists in population?
One possible way is using Null Hypothesis Significance Testing (NHST)
There is strong criticism of this approach
It is, nonetheless, very widely used
 PDF
PDFDecisions, decisions
How do we decide that a difference/effect in our sample actually exists in population?
One possible way is using Null Hypothesis Significance Testing (NHST)
There is strong criticism of this approach
It is, nonetheless, very widely used
Alternatives exist!
 PDF
PDFNHST
- Formulate a research hypothesis (from conceptual to statistical)
- Formulate the null hypothesis
- Choose appropriate test statistic
- Define the probability distribution of the test statistic under the null hypothesis
- Gather and analyse (enough) data: calculate sample test statistic
- Get the probability of the value you got under the null hypothesis
- If the observed value is likely under the null, retain the null
- If it is unlikely under the null, reject the null in favour of research hypothesis, celebrate!
 PDF
PDFHypotheses
Back to climbers and ape index
Rather than a directional hypotheses (climbers have longer arms than non-climbers), it's more useful to formulate a hypothesis of some difference or effect
Statistical hypothesis: μAI_climb≠μAI_gen
 PDF
PDFThe null hypothesis
Negation of the statistical hypothesis
Very often about no difference/effect (but not necessarily)
Statistical (alternative) hypothesis: H1:μAI_climb≠μAI_gen
Null hypothesis: H0:μAI_climb=μAI_gen
 PDF
PDFThe null hypothesis
Negation of the statistical hypothesis
Very often about no difference/effect (but not necessarily)
Statistical (alternative) hypothesis: H1:μAI_climb≠μAI_gen
Null hypothesis: H0:μAI_climb=μAI_gen
H1 and H0 represent alternative realities (like parallel universes!)
One where there is a difference of effect
One where there isn't one
NHST is about deciding which one of the two realities we live in
 PDF
PDFTest statistic
Mathematical expressions of what we're measuring (difference, effect, relationship...)
There are many available test statistics, useful for different scenarios
For now, let's just take simple difference in means: D=¯¯¯¯¯¯AIclimb−¯¯¯¯¯¯AIgen
If null hypothesis is true, we'd expect D=0, i.e., no difference between climbers' and non-climbers' AI
 PDF
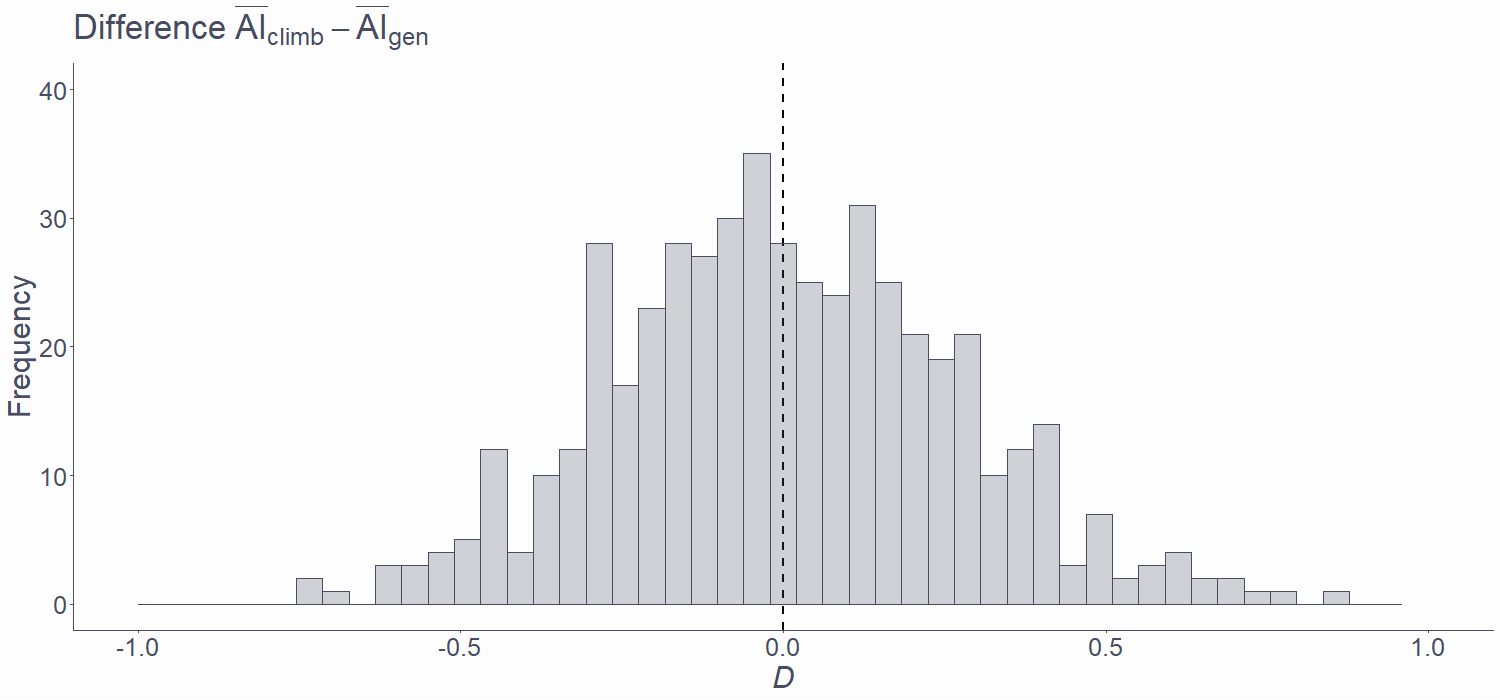
PDFDistribution of test statistic under H0
H0 represents a world where there is no difference in average ape index between elite climbers and the general population
Even if true difference in population (Δ; delta) is zero, D can be non-zero in sample (here N = 30)
For simplicity, assume AIgen is normally distributed in population with μ=0 and σ=1

 PDF
PDFDistribution of test statistic under H0
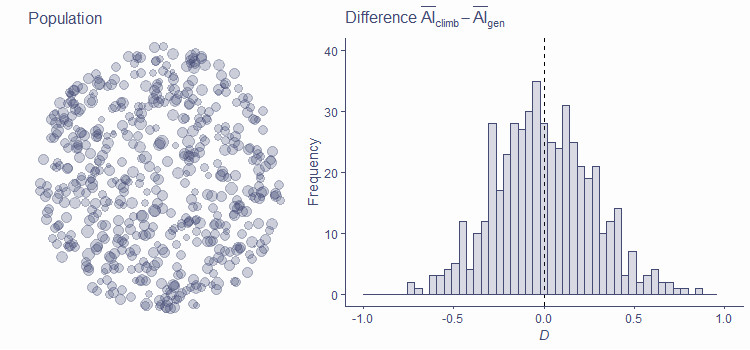
Expected value of D under H0 is 0
More often than not D will not be equal to 0 in sample
 PDF
PDFDistribution of test statistic under H0

Expected value of D under H0 is 0
More often than not D will not be equal to 0 in sample
Small departures from 0 are common, large ones are rare
 PDF
PDFDistribution of test statistic under H0

Expected value of D under H0 is 0
More often than not D will not be equal to 0 in sample
Small departures from 0 are common, large ones are rare
Distribution of test statistic is dependent on N!
 PDF
PDFDistribution of test statistic under alternative hypothesis
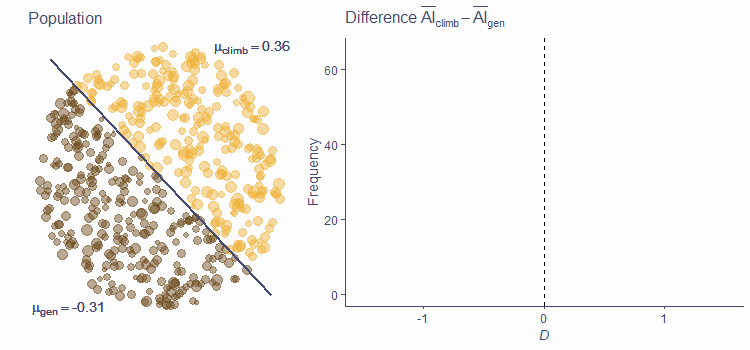
H1 represents a world where there is a difference in average ape index between elite climbers and the general population
If H1 is true, the sampling distribution of the test statistics is not centred around zero
Sometimes, a null result can still be observed (false negative; Type II error)
 PDF
PDFProbability of test statistic under H0
- Once we know what the distribution of our test statistic is, we can assess the probability of getting any given observed value or a more extreme value of D
 PDF
PDFGather data and calculate the test statistic
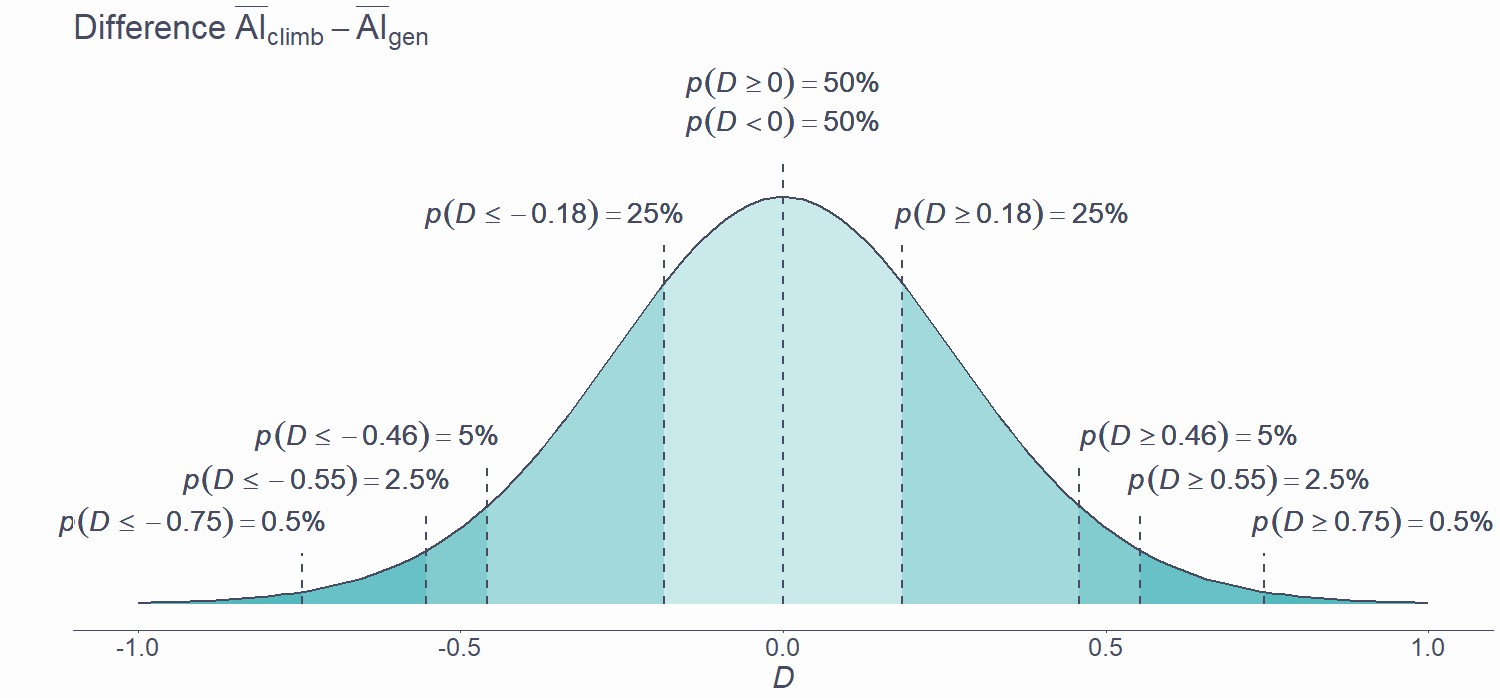
Say we collected AI measurements from 30 climbers and 30 non-climbers
We calculated the mean difference, D = 0.47
 PDF
PDFGather data and calculate the test statistic

Say we collected AI measurements from 30 climbers and 30 non-climbers
We calculated the mean difference, D = 0.47
Calculate probability of observed statistic under H0
 PDF
PDFThe p-value
The p-value is the probability of getting a test statistic at least as extreme as the one observed if the null hypothesis is really true
 PDF
PDFThe p-value
The p-value is the probability of getting a test statistic at least as extreme as the one observed if the null hypothesis is really true
- Tells us how likely our data are if there is no difference/effect in population
 PDF
PDFThe p-value
The p-value is the probability of getting a test statistic at least as extreme as the one observed if the null hypothesis is really true
Tells us how likely our data are if there is no difference/effect in population
Does not tell us the probability of H0 or H1 being true
 PDF
PDFThe p-value
The p-value is the probability of getting a test statistic at least as extreme as the one observed if the null hypothesis is really true
Tells us how likely our data are if there is no difference/effect in population
Does not tell us the probability of H0 or H1 being true
Does not tell us the probability of our data happening "by chance alone"
 PDF
PDFDecision
So we have
- Data
- Test statistic
- Distribution of test statistic
- p(test_stat) under H0
 PDF
PDFDecision
So we have
- Data
- Test statistic
- Distribution of test statistic
- p(test_stat) under H0
What now?
 PDF
PDFDecision
So we have
- Data
- Test statistic
- Distribution of test statistic
- p(test_stat) under H0
What now?
We reject H0 and accept H1 if we judge our result to be unlikely under H0
 PDF
PDFDecision
So we have
- Data
- Test statistic
- Distribution of test statistic
- p(test_stat) under H0
What now?
We reject H0 and accept H1 if we judge our result to be unlikely under H0
We retain H0 if we judge the result to be likely under it
 PDF
PDFHow likely is likely enough?
This is an arbitrary choice!
Commonly used significance levels are
- 5% (.05; most common in psychology)
- 1% (.01)
- 0.1% (.001)
If p-value is less than our chosen significance level, we call the result statistically significant (sufficiently unlikely under H0)
Significance level must be chosen before results are analysed!
 PDF
PDFWhat about the ape index?
- We found a mean difference in AI between climbers and non-climbers of 0.47
 PDF
PDFWhat about the ape index?
We found a mean difference in AI between climbers and non-climbers of 0.47
This statistic has an associated p-value = .093
 PDF
PDFWhat about the ape index?
We found a mean difference in AI between climbers and non-climbers of 0.47
This statistic has an associated p-value = .093
Under the most common significance level in psychology (.05), this is not a statistically significant difference
 PDF
PDFWhat about the ape index?
We found a mean difference in AI between climbers and non-climbers of 0.47
This statistic has an associated p-value = .093
Under the most common significance level in psychology (.05), this is not a statistically significant difference
We thus retain the null hypothesis and report not having found a difference: our hypothesis was not supported by the data
The difference we observed is not big enough for us to dismiss the assumption that we live in the world of H0
 PDF
PDFTake-home message
Hypotheses should be clearly formulated, testable, and operationalised
Statistical hypotheses are statements about values of some parameters
Null hypothesis (usually, parameter is equal to 0) is the one we test (in NHST framework)
We can only observe samples, but we are interested in populations
Due to statistical fluctuations, we can find a relationship in sample even if one doesn't exist in population
NHST is one way of deciding if sample result holds in population: understanding it is crucial!
The p-value is the probability of getting a test statistic at least as extreme as the one observed if the null hypothesis is really true
 PDF
PDF