Looking Ahead (and Behind)
Last week: Correlation
This week: Chi-Square ( )
Week 6: t-test
Week 7: The Linear Model
Week 8: The Linear Model
Lab Report: Green Study
Today we will talk about one of the analyses for the lab report
: Green study (Griskevicious et al., 2010)
t-test: Red study (Elliott et al., 2020), next week
We will talk about the lab report in the lectures and work on it in the practicals
- Make sure you come to your registered sessions
Objectives
After this lecture you will understand:
The concepts behind tests of goodness-of-fit and association
How to calculate the statistic
How to read tables and figures of counts
How to interpret and report significance tests of
The relationship between association and causation

Roll of the Dice
I want to know if my four-sided die (d4) is fair
If it is, each number should come up with equal probability
- Four numbers = 100%/4 = 25% probability of rolling each number
So, if I roll the dice 100 times, each number should come up (approximately) 25 times
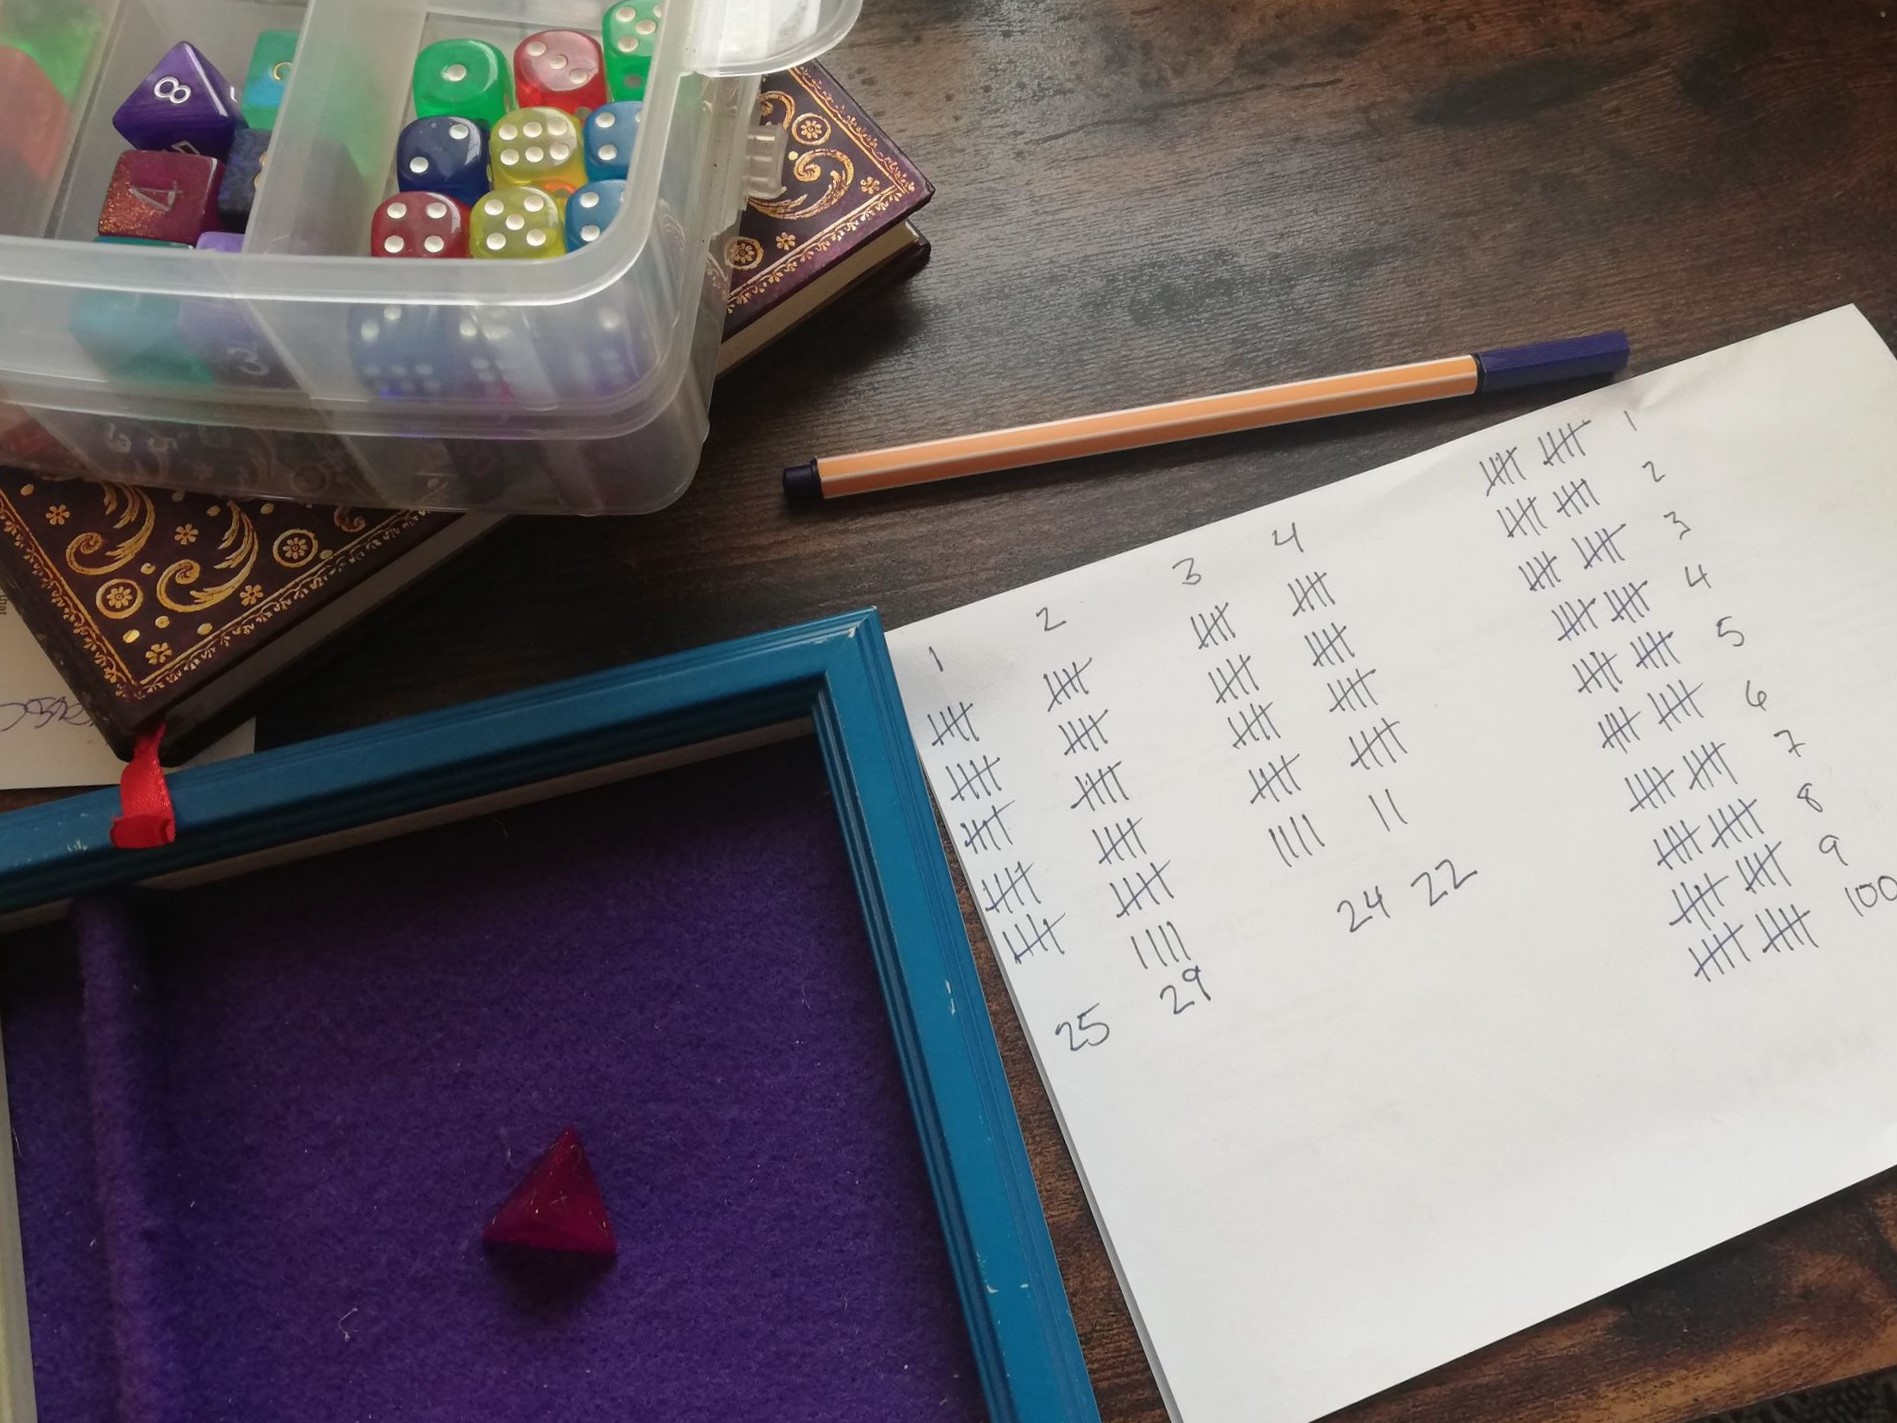
A Fair Shake?
These numbers are not exactly 25/25/25/25
- But we live in a random universe!
How different is different enough to believe that the die is not actually fair?

Steps of the Analysis
- Calculate the (standardised) difference between observed and expected frequencies
Steps of the Analysis
Calculate the (standardised) difference between observed and expected frequencies
Compare that test statistic to its distribution under the null hypothesis
Steps of the Analysis
Calculate the (standardised) difference between observed and expected frequencies
Compare that test statistic to its distribution under the null hypothesis
Obtain the probability p of encountering a test statistic of the size we have, or larger, if the null hypothesis is true
Steps of the Analysis
Calculate the (standardised) difference between observed and expected frequencies
Compare that test statistic to its distribution under the null hypothesis
Obtain the probability p of encountering a test statistic of the size we have, or larger, if the null hypothesis is true
?????
Profit
Step 1: Calculate a Test Statistic
- How different are the observed counts from the expected counts?
| Dice Roll | Obs. Count | Exp. Count |
|---|---|---|
| 1 | 25 | 25 |
| 2 | 29 | 25 |
| 3 | 24 | 25 |
| 4 | 22 | 25 |
Step 1: Calculate a Test Statistic
- How different are the observed counts from the expected counts?
| Dice Roll | Obs. Count | Exp. Count |
|---|---|---|
| 1 | 25 | 25 |
| 2 | 29 | 25 |
| 3 | 24 | 25 |
| 4 | 22 | 25 |
Step 1: Calculate a Test Statistic
- How different are the observed counts from the expected counts?
| Dice Roll | Obs. Count | Exp. Count |
|---|---|---|
| 1 | 25 | 25 |
| 2 | 29 | 25 |
| 3 | 24 | 25 |
| 4 | 22 | 25 |
Step 1: Calculate a Test Statistic
- How different are the observed counts from the expected counts?
| Dice Roll | Obs. Count | Exp. Count |
|---|---|---|
| 1 | 25 | 25 |
| 2 | 29 | 25 |
| 3 | 24 | 25 |
| 4 | 22 | 25 |
Step 1: Calculate a Test Statistic
- How different are the observed counts from the expected counts?
| Dice Roll | Obs. Count | Exp. Count |
|---|---|---|
| 1 | 25 | 25 |
| 2 | 29 | 25 |
| 3 | 24 | 25 |
| 4 | 22 | 25 |
The total squared (and scaled) difference between observed and expected counts is the sum of those four numbers, or 1.04
Step 2: Compare to the Distribution
We've calculated a test statistic that represents the thing we are trying to test
- Is this test statistic big or small in the grand scheme of things?
Step 2: Compare to the Distribution
We've calculated a test statistic that represents the thing we are trying to test
- Is this test statistic big or small in the grand scheme of things?
Compare our test statistic to the distribution of similar statistics
- IMPORTANT: These distributions assume that the null hypothesis is true!
The Chi-Square (χ2) Distribution
Unfortunately test statistics like the one we have are not normally distributed
No problem - we just have to use a different distribution!
The Chi-Square (χ2) Distribution
Unfortunately test statistics like the one we have are not normally distributed
No problem - we just have to use a different distribution!
Meet the distribution
The sum of squared normal distributions
See this excellent Khan Academy explainer for more!
Detour: Degrees of Freedom
Degrees of freedom are calculated differently for different test statistics
- Important because they determine the distribution's shape and proportions
At base, they are the number of values that are free to vary
Detour: Degrees of Freedom
Degrees of freedom are calculated differently for different test statistics
- Important because they determine the distribution's shape and proportions
At base, they are the number of values that are free to vary
Consider our dice example...
We know our test statistic is 1.04
If we know the first three values (0 + 0.64 + 0.04), the last value must be 0.36
Alternatively, if we had three random values (e.g. 0.23 + 0.54 + 0.1), the last value cannot be random: it must be 0.17 to add up to 1.04
So, we have three degrees of freedom
Step 3: Obtain the Probability p
Look at the distribution for 3 degrees of freedom
What percentage of the distribution is greater than or equal to 1.04?
Interpreting the Results
The sum of squared differences between our expected and observed counts ( ) was 1.04
For a distribution with 3 degrees of freedom, this value is extremely common under the null hypothesis!
If our die is fair, our data are extremely likely
To believe that the die was not fair, we would have needed a test statistic of ~7.8 or greater ( = .05)
If only there were an easier way to do this...!
chisq.test(dice_table$obs_count)## ## Chi-squared test for given probabilities## ## data: dice_table$obs_count## X-squared = 1.04, df = 3, p-value = 0.7916Interim Summary
The test statistic quantifies how different a set of observed frequencies are from expected frequencies
We obtain the probability p of finding the test statistic we have calculated (or one even larger) using the distribution of the statistic under the null hypothesis, with a given number of degrees of freedom
Given an level of .05...
If p > .05, we conclude that our results are likely to occur under the null hypothesis, so we have no evidence that the null hypothesis is not true
If p < .05, we conclude that our results are sufficiently unlikely to occur that it may in fact be the case that the null hypothesis is not true
More χ2
We just saw a goodness of fit test
- Tests whether a sample of data came from a population with a specific distribution
Next, let's look at a test of association, or independence
- Are two categorical variables associated or not?
More χ2
We just saw a goodness of fit test
- Tests whether a sample of data came from a population with a specific distribution
Next, let's look at a test of association, or independence
- Are two categorical variables associated or not?
For your lab reports, you will again write about the Green or Red studies
You can freely choose which!
If you choose the Green study, this is the test you will use
Quick Refresher: Variable Types
Continuous data
Represent some measurement or score on a scale
Examples: ratings of romantic attraction, age in years
Answers the question: how much?
Quick Refresher: Variable Types
Continuous data
Represent some measurement or score on a scale
Examples: ratings of romantic attraction, age in years
Answers the question: how much?
Categorical data
Represent membership in a particular group or condition
Examples: control vs experimental group, year of uni
Answers the question: which one?
χ2 Test of Association
This time we will have two variables, both categorical
Data: counts of how many observations fall into each combination of categories
Sequence-Space Synaesthesia
- Spatial orientation of sequences, such as numbers, months, or days of the week

Sequence-Space Synaesthesia
"Calendars" of spatial orientations of months of the year
Brang et al. (2011): Is the orientation of the calendar related to the synaesthete's handedness?
Orientation: months progress clockwise or counterclockwise in space
Handedness: left or right handed
Sequence-Space Synaesthesia
"Calendars" of spatial orientations of months of the year
Brang et al. (2011): Is the orientation of the calendar related to the synaesthete's handedness?
Orientation: months progress clockwise or counterclockwise in space
Handedness: left or right handed
Each synaesthete has one value for orientation and one value for handedness
- Data: counts of how many synaesthetes fall into each combination of categories
Let's Think About This...
What is the null hypothesis in this case?
What is the alternative hypothesis?
What do you think we will find?
Let's Think About This...
Null hypothesis: Calendar orientation is not associated with synaesthete handedness
Alternative hypothesis: Calendar orientation is associated with synaesthete handedness
Prediction from the paper:
Right-handed synaesthetes will tend to have a clockwise calendar
Left-handed synaesthetes will tend to have an anticlockwise calendar
Visualising the Data

ggplot(ss_tab, aes(x = handedness, y = n)) + geom_bar( aes(fill = orientation), stat="identity", position = position_dodge(0.8), width = 0.7) + labs(x = "Handedness", y = "Frequency", fill = "Calendar\nOrientation") + scale_y_continuous(limits = c(0, 20)) + scale_color_manual(values = c("#009FA7", "#52006F"))+ scale_fill_manual(values = c("#009FA7", "#52006F"), labels = c("Anticlockwise", "Clockwise"))+ scale_x_discrete(labels = c("Left","Right"))Left-handed synaesthetes have more anti-clockwise than clockwise
Right-handed synaesthetes have the reverse
Test Result
Are these data different enough from the expected frequencies to believe that there may be an association between orientation and handedness?
## ## Pearson's Chi-squared test with Yates' continuity correction## ## data: seq_space$orientation and seq_space$handedness## X-squared = 9.7798, df = 1, p-value = 0.001764What can you conclude from this result?
Test Result
Are these data different enough from the expected frequencies to believe that there may be an association between orientation and handedness?
## ## Pearson's Chi-squared test with Yates' continuity correction## ## data: seq_space$orientation and seq_space$handedness## X-squared = 9.7798, df = 1, p-value = 0.001764Interpreting the Result
ggplot(ss_tab, aes(x = handedness, y = n)) + geom_bar( aes(fill = orientation), stat="identity", position = position_dodge(0.8), width = 0.7) + labs(x = "Handedness", y = "Frequency", fill = "Calendar\nOrientation") + scale_y_continuous(limits = c(0, 20)) + scale_color_manual(values = c("#009FA7", "#52006F"))+ scale_fill_manual(values = c("#009FA7", "#52006F"), labels = c("Anticlockwise", "Clockwise"))+ scale_x_discrete(labels = c("Left","Right"))Our hypothesis is supported by the data
- The association is in the direction we predicted
Expected Frequencies
Are these data different enough from the expected frequencies to believe that there may be an association between orientation and handedness?
- We can get these easily out of R!
Expected Frequencies
Are these data different enough from the expected frequencies to believe that there may be an association between orientation and handedness?
- We can get these easily out of R!
| Orientation | Left | Right |
|---|---|---|
| Anti-Clockwise | 3.53 | 8.47 |
| Clockwise | 6.47 | 15.53 |
One of the assumptions of is that all expected frequencies are greater than 5
Otherwise this test can give you a drastically wrong answer 😱
In this case, use Fisher's exact test (
fisher.test()) instead
Final Overview
The test quantifies the difference between observed and expected frequencies
Goodness of Fit
- Tests whether a sample of data came from a population with a specific distribution 🎲
Test of Association/Independence
- Tests whether two categorical variables are associated with each other 🌈
Like with correlation, association is not causation
For quizzes/exam:
You will not be expected to calculate by hand!
You will be expected to read and interpret the output of
chisq.test()for tests of associationMore in the tutorial!
Lab Reports
You can choose either the red or green study to write your report on
- See Lab Report Information on Canvas for more
If you choose the green study (Griskevicius et al., 2010), you must use and report the results of
Lab Reports
You can choose either the red or green study to write your report on
- See Lab Report Information on Canvas for more
If you choose the green study (Griskevicius et al., 2010), you must use and report the results of
Choose one of three products to analyse
Report observed frequencies and result
Include a figure of the results
Will be covered in depth in the next tutorial and practical!